Welcome back to our three-part series on the importance of improving in-vitro in-vivo correlation (IVIVC) in the testing of orally inhaled and nasal drug products (OINDPs).
In part one of this series, we explored why clinical relevance matters and how the use of throat and nose models can support this goal. In this second part, we’re focusing on breathing profiles – a critical yet often oversimplified factor in OINDP performance testing.
Why breathing profiles matter
Advice for patients on how to breathe when using an OINDP varies according to product type. For dry powder inhalers (DPIs) the typical instruction is to take a fast, deep forceful breath while for metered dose inhalers (MDIs) a slow, deep breath is preferable. In contrast, nasal spray users may be told to avoid inhaling too deeply, but with a nebuliser, patients simply breathe normally.
In other words, a different recommended inhalation technique for each type of OINDP, which patients may or may not be adept at applying. Moreover, even among patients using the same type of OINDP, inhalation technique can vary significantly.
Simulating realistic breathing profiles during testing can help us understand how such variability affects drug delivery and assess the impact of differences in patient physiology and practice. This is extremely valuable for those targeting better IVIVCs.
What do the compendial methods call for?
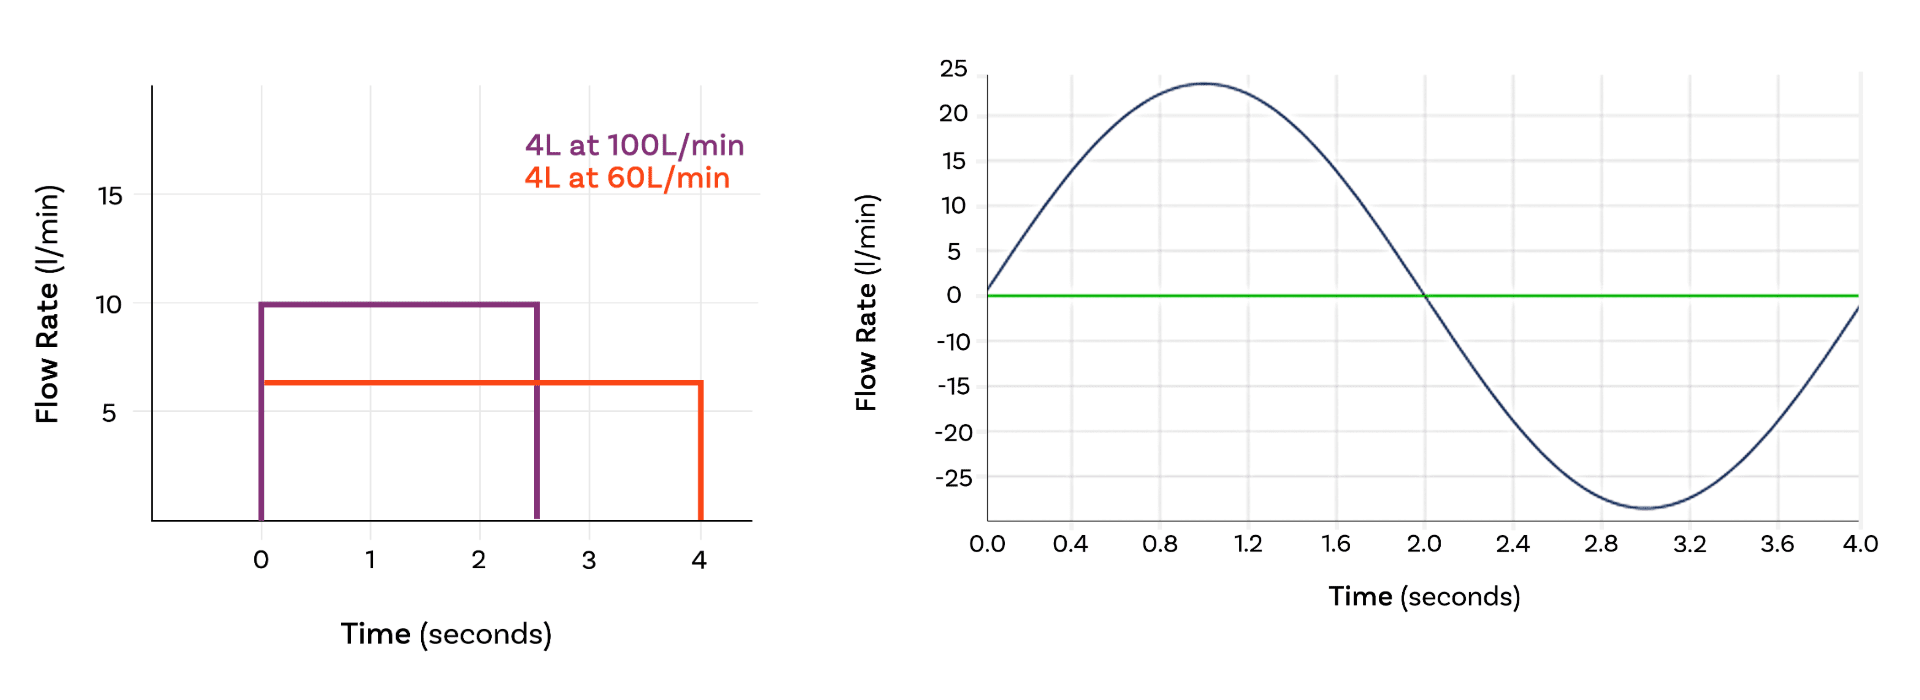
Most compendial methods apply a simple, square wave air flow profile – an on/off, constant flow rate – during testing. However, there are two key exceptions:
Delivered Dose Uniformity (DDU) testing for nebulisers
Adult | Neonatal | Infant | Child | |
Total Volume | 500 ml | 25 ml | 50 ml | 155 ml |
Frequency | 15 cycles/min | 40 cycles/min | 30 cycles/min | 25 cycles/min |
Waveform | Sinusoidal | Sinusoidal | Sinusoidal | Sinusoidal |
I/E Ratio | 1:1 | 1:3 | 1:3 | 1:2 |
The table above shows breathing profiles for DDU testing for nebulisers, for different patient groups, as specified in USP <1601> and Ph. Eur. 2.9.44. Both active drug delivery rate and the total amount of drug delivered in a specified timeframe (typically 60 seconds) are measured.
DDU testing for MDIs with add-on devices
USP <1602> provides specifications for testing MDIs with add-on devices such as spacers and valved holding chambers (see table below). Here, methods additionally simulate coordinated and uncoordinated use, to assess the impact of the patient inhaling or exhaling as the device is actuated.
Parameter | Neonate | Infant | Child | Adult 1 | Adult 2 |
Tidal volume (ml) | 25 | 50 | 155 | 770 | 500 |
Frequency (cycles /min) | 40 | 30 | 25 | 12 | 13 |
I/E Ratio | 1:3 | 1:3 | 1:2 | 1:2 | 1:2 |
Minute Volume (ml) | 1000 | 1500 | 3875 | 9240 | 6500 |
Despite these requirements for DDU testing, compendial methods for the measurement of aerodynamic particle size distribution (APSD) consistently call for the application of a square wave air flow profile.
Why? Because the cascade impactors used for APSD require a constant air flow rate, complicating the application of variable breathing patterns.
Enter realistic APSD
Recent FDA product-specific guidances (PSGs) have introduced the concept of realistic APSD measurement, a refinement to current pharmacopoeial methods.
Measuring realistic APSD relies on the use of:
- clinically relevant mouth-throat models
- suitable inhalation profiles: specifically, “weak” and “strong” inhalation profiles that reflect real variation in the intended patient population.
Used alongside other in vitro methods, realistic APSD helps establish bioequivalence, and may even support waiving the need for a clinical endpoint trial in abbreviated new drug applications (ANDAs).
The introduction of realistic APSD raises the question: What does a square wave miss?
Primarily, it’s time to peak flow. Square waves assume air flow jumps instantaneously from zero to the specified value, which isn’t physiologically accurate. The reality is a rapid, but not instant, ramp up to peak flow. This finite acceleration rate can be crucial for dose dispersion especially for DPIs. Similarly, flow rate dies away towards the end of an inhalation manoeuvre, though this has far less impact on inhaled drug delivery.
How to measure realistic APSD
To incorporate realistic APSD into testing:
- Define the target patient population
- Characterise representative breathing profiles in terms of peak flow, time to peak flow and total inhaled volume
- Duplicate profiles at either end of a relevant spectrum (weak and strong) using a suitable breathing simulator.
It’s worth noting that PSGs for both MDIs and DPIs reference realistic APSD i.e. it is not limited to any single product class.
Why go beyond regulatory requirements?
Even when not required, many researchers apply realistic breathing profiles in development — particularly for DPIs.
As we’ve discussed before, DPIs are passive devices with drug delivery driven solely by the inhalation manoeuvre of the patient. The ‘shape’ and strength of that manoeuvre is therefore especially important for these devices.
Using realistic breathing profiles during DPI development can help to:
- Assess the impact of device resistance, informing device design decisions.
- Investigate the suitability of a product for a target patient population (age, gender, disease state).
- Identify the need for formulation changes to improve device emptying and/or dose dispersion.
Extending to nasal drug delivery
Interest is also growing in how breathing profiles impact nasal drug deposition, especially for formulators targeting systemic action.
We are learning steadily how to target different regions of the nasal cavity to optimise drug delivery for different applications and it’s becoming clear that breathing profiles are a factor. As a result, pioneers in this field are already experimenting with in vitro methods that incorporate breathing profiles as a variable in intranasal drug delivery.
Final thoughts
Whether you’re meeting a regulatory requirement or pushing for deeper product understanding, incorporating clinically realistic breathing profiles is a powerful tool in OINDP development. You can read more about improving IVIVCs here.
In the third and final blog of our improving IVIVCs series, we’ll explore how advanced in vitro testing can reveal how products behave in real-world patient use and what that means for optimising performance.
Subscribe now for ongoing expert analysis and technical updates in OINDP testing advancements, plus get notified when the final instalment in our IVIVC series is published.